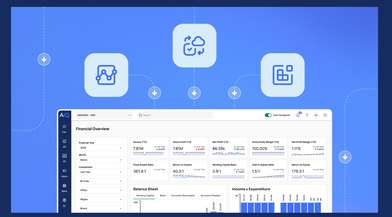
There are 3 new dynamic for Balance Sheet, Profit & Loss and Trial Balance that you can use as the basis for defining your own customised reports by choosing from an extensive list of settings. The reports can be accessed from the ‘Custom GL Reports’ grouping in the Report Manager.
Flexibility to Add Up to 12 Value Columns of your choice
The reports provide the ability to select up to 12 dynamic value columns at one time based the values chosen from the parameters along with Financial Month and Financial Year. In addition, Analysis Groups and Analysis Codes can be selected to filter the data but are not required.
Once Financial Month and Financial Year are selected the 12 columns can show the following figures:
1) Actual – which can be drilled down to the account transaction detail
2) Last Year
3) YTD
4) YTD Last Year
5) Actual Budget
6) Actual Revised Budget
7) Last Year Budget
8) Last Year Revised Budget
9) Actual YTD Budget
10) Actual YTD Budget Revised
11) Last Year YTD Budget
12) Last Year YTD Budget Revised
13) Variance (Actual to Last Year) – also can be shown in percentage format
14) Variance (Actual YTD to Last Year YTD) – also can be shown in percentage format
15) Variance (Actual to Actual Budget) – also can be shown in percentage format
16) Variance (Actual to Actual Budget Revised) – also can be shown in percentage format
17) Variance (Actual YTD to Actual YTD Budget) – also can be shown in percentage format
18) Variance (Actual YTD to Actual YTD Budget Revised) – also can be shown in percentage
19) Variance (Last Year to Last Year Budget) – also can be shown in percentage format
20) Variance (Last Year to Last Year Budget Revised) – also can be shown in percentage
21) Variance (Last Year YTD to Last Year YTD Budget) – also can be shown in percentage
22) Variance (Last Year YTD to Last Year YTD Budget Revised) – also can be shown in percentage format
23) Sales Actual %
24) Sales Last Year %
25) Sales YTD %
26) Sales YTD Last Year %
27) Sales Actual Budget %
28) Sales Actual Revised Budget %
29) Sales Last Year Budget %
30) Sales Last Year Revised Budget %
31) Sales Actual YTD Budget %
32) Sales Actual YTD Budget Revised %
33) Sales Last Year YTD Budget %
34) Sales Last Year YTD Budget Revised %
If not all columns are required the option ‘Not Used’ can be selected to hide them.
Additional Customisation Options
The reports include additional options as below:
1) 5 types of font can be selected: Tahoma, Times New Roman, Arial, Calibri and Montserrat
2) Headers can be hidden
3) Decimal options are: Millions, Thousands, no decimal places, tenths or hundredths
4) Logo can be shown on report (same as the company logo on system)
5) GL Codes can be suppressed so just the names of the accounts will be shown
6) Negative Variance values can be shown in red colour
7) Custom Notes can be added to the Footer of the report to enable you to display any relevant free text at the bottom
8) Negative Number Format can be selected in 3 different formats: Minus, Trailing Minus or Parenthesis
9) The Categories and Subcategories can be contracted/expanded in order to show or not the accounts level detail
The objective here is to introduce a much greater level of flexibility into the reporting content and format delivered from within the system itself. The reports have also been designed to export to Excel without any cell merging issues and retain their format exactly as in the system.
Further Updates Planned
A future update of this functionality will include the ability for the user to save versions of the same report under a user defined name. This means that the same user will be able to save different versions of the same report which would save the associated parameters and then allow for easier recall and regeneration at a future point.


